

Shining a Spotlight on the Future Adoption & Use Cases for Secure Hardware
Posted on 15th November 2019 at 09:54
We have published a new infographic following our latest update to our core Market Intelligence Service: Digital Secure Solutions for Credentials, Embedded + IoT Devices. As highlighted in the infographic, the service provides a unique and comprehensive insight into the current and future demand for secure hardware solutions. Its aim is to enable semiconductor, card/credential and device manufacturers, as well as platform and service providers, to track and monitor market developments and determine its future direction. The benefit for our clients is being able to identify future market disruption and stay informed as to how potential regulation and additional external factors may affect them and their customers.
For example, the headline statistic in the infographic is that “the market for secure credentials and embedded hardware for connected devices increased in value by 15.3% in 2018 and is forecast to grow rapidly by a further 49.1% by 2023 as emerging applications in the IoT implement security, resulting in digital credentials being introduced alongside existing smart cards”.
How did your company fare in 2018? Do you expect to grow by 50% in the next five years?
A Holistic Service that Tracks & Forecasts Both Traditional Smart Card and New Embedded Security
Our service allows companies to stay in touch with market trends and understand what products and applications are driving this. Concurrently, it provides detailed analysis on traditional cards and solutions in more established markets as well as solutions targeting more greenfield applications in the IoT. Much has been stated for years by leading smart card vendors about digital migration and digital transformation of their target markets, but the reality is that most of their revenues continue to be driven by smart cards and secure ICs. It is important that vendors and service providers maximise their existing legacy businesses and bring those markets and customers with them. If they move to prioritise the new, shiny digital solutions too soon their existing customers will feel under-valued and be more open to new suppliers. Our service helps to aid and assist our clients’ planning and strategy for evolving their business roadmaps and product portfolios in order to help their customers go on this journey with them.
A Unique Level of Detail Across Secure Solutions & Applications
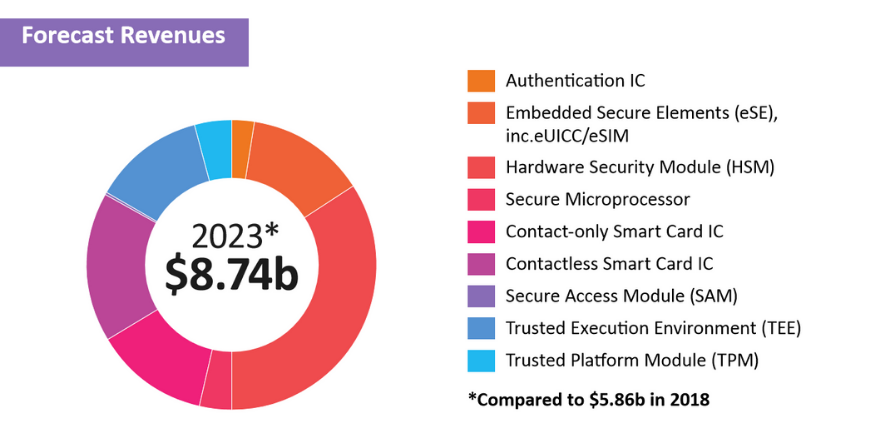
Market data is presented in a multitude of ways to allow companies to view it in the most appropriate manner for them. Annual shipment data and annual revenues are included for nine different hardware categories and address the spectrum of devices across 13 different industries. Massive growth is forecast for (rack-mounted and chip-based) HSMs as companies look to protect their supply chains and manufacturing, securely managing device lifecycles with eSEs (including eUICC) and TEEs are each forecast to account for more than 10% of market value in 2023. Conversely, whilst smart card ICs may appear to be going backwards – they were estimated to account for ~45% of market revenues in 2018, a figure forecast to decline to 30% in 2023 – it is shown to be more of a flat market with volumes increasing overall.
Newly Connected Markets in the IoT are Adopting Higher-Value Secure Solutions
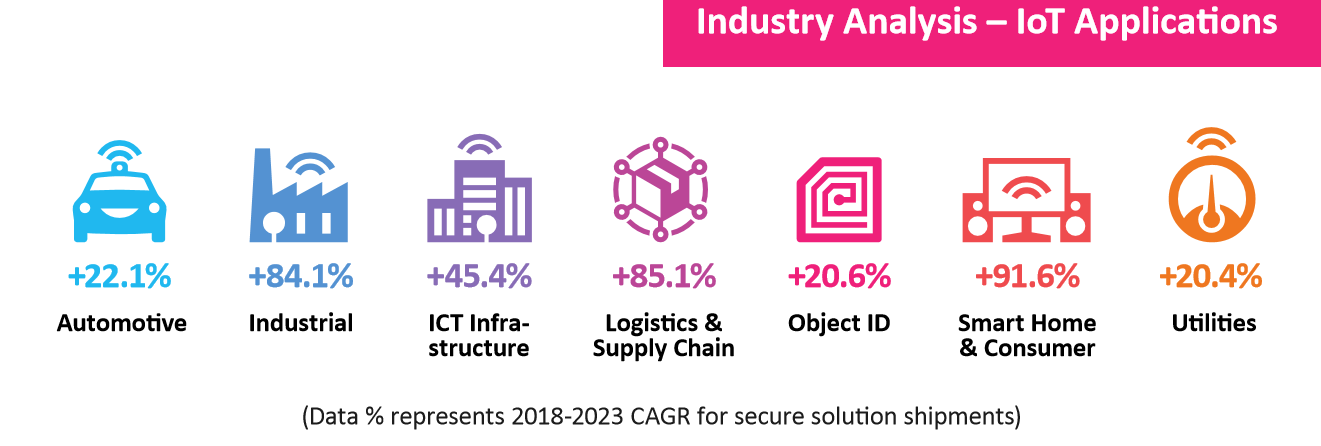
Referring to the infographic again, it shows which sectors are driving growth. More established markets, such as Content Protection, ID + Authentication (of people), Mobile + SIM, Payments + Banking and Ticketing + Access, continue to grow in consumption of secure solutions but at a CAGR of 2.5-5.0%. This is nice, steady growth that one might expect and be reasonably happy with. However, contrasting with this are the newer markets, largely subsets of the IoT, including Automotive, Industrial, ICT Infrastructure, Logistics + Supply Chain, Object ID, Smart Home + Consumer and Utilities. These are currently smaller markets but they are adopting higher-value embedded secure solutions which is accelerating the overall market size and magnifying their impact on market revenues. By contrast with the traditional markets these IoT sectors are forecast CAGRs of 20-90% over the next five years. As a result, P.A.ID Strategies predicts total market value to grow by 49.1%, from $5.86 billion in 2018 to $8.74 billion in 2023. Our analysis expects the IoT applications to account for 44% of this in 2023.
Our service allows companies to see how, where and when this growth (and sometimes decline) occurs and the accompanying report examines and presents the reasons identified for this.
Spotlight Statistics – Sectors Reviewed
The spotlight stats in the infographic focus on three areas and have been picked to highlight the emergence of new solutions and show how these are impacting the market and demonstrating how companies need to address the trends affecting the market in order to be ready for the future.
Smart card shipments are expected to increase in volume; however, their make-up will be quite different in a relatively short timeframe. Whilst much larger, with cumulative shipments of 42.4 billion units, we expect contact-only smart cards to increase in volume by just 0.8% by 2023. By contrast, the smaller (19.9 billion cumulative shipments forecast) but more valuable market for dual-interface and contactless smart cards is predicted to grow by 49.5% in the same five-year period.
In the mobile space, with a second consecutive year of decline in SIM card shipments expected for 2019, we are now seeing on-going development and growth for embedded solutions, including eSEs, eSIMs (eUICCs) and TEEs. Combined, eSEs and eSIMs will exceed half a billion units in smartphones (and a limited number of featurephones) this year. This is still a small number compared to removable SIM card volumes of 5.3 billion but their much greater ASP will see the forecast future annual sales of eSEs and eSIMs increase by $799 million to 2023 compared to removable SIMs’ £35 million.
Smart home is an interesting area, primarily because it is so poorly protected currently – we estimate that only 3.3% of the 156.7 million devices shipped in 2018 featured secure hardware. It is highly fragmented in nature, encompassing a broad array of devices, from access and security, to environmental controls and monitoring to networking infrastructure plus an array of consumer electronics devices. P.A.ID Strategies sees a variety of different solutions and approaches to be tested and implemented with differing levels of success; in part in response to growing activity amongst regulators (and a small number of OEMs and service providers) with the aim of improving privacy and cybersecurity. As a result, we believe that 36.7% of the 363.5 million devices shipping in 2023 will feature secure hardware, an increase of 2,482% over 2018!
P.A.ID Strategies Provides Understanding & Actionable Data to Maximise These Opportunities
Our aim is to help our clients make better business decisions. The datapoints in our new infographic were selected to demonstrate the opportunities that exist as well as our market understanding and outlook on the market. The Market Intelligence Service: Digital Secure Solutions for Credentials, Embedded & IoT Devices upon which this is based tracks and forecasts scores of devices and verticals and examines how vendors and OEMs are developing their products to shape and meet market requirements. The detailed data (by volume, by revenue, by component/solution, by credential and device, by market and by application) is accompanied by a summary report that explains the reasoning and assumptions as well as highlighting the factors and trends upon which they are based.
We hope you like our infographic (it can be downloaded here) and we hope you see how this unique service can provide you with a holistic overview of the market, understanding the relationship between the traditional and emerging, the interplay between smart cards and embedded IoT to help you make better business decisions. Please contact us to arrange a discussion and request a one-to-one presentation of the latest findings.
Tagged as: authentication, automotive, contactless, digital security, embedded, eSE, eSIM, eUICC, HSM, ICs, identity, infrastructure, IoT, IoT security, mobile, payments, SAM, security, SIM, smart cards, smart home, TEE, TPM, trusted execution environment, trusted platform module, utilities
Share this post: